
Index Concentration, Revisited

September 18, 2023
In June 2020, we looked at record-high-and-rising holdings concentration among several popular US and ex-US stock indices. Since then, holdings concentration has moderated in some of the indices we examined but has hit record levels in others. Since participants (and investors in general) often take diversification for granted in index funds, fiduciaries need to stay on top of what's happening under the hood. The current situation is rife with potential for surprise.
Summary
In a cap-weighted index, component stocks are weighted according to their market capitalization (stock price x outstanding shares); the highest cap stocks have the heaviest weightings within the index.
Cap-weighted index funds that track the largest capitalization stocks have greater potential for significant holdings concentration and volatility of concentration than those that follow small- and mid-cap segments.
Rule changes or composition decisions by index providers (e.g., MSCI expanding inclusion of Chinese equities) can also impact holdings concentration.
The S&P 500 and Russell 1000 Growth are highly concentrated compared to historical levels.
Holdings concentration in indices will carry through to active funds constrained to those benchmarks.
US Large Cap Indices
US large-cap equity indices have experienced some of the most significant variations in the concentration of holdings over time. Because these indices sit at the top of the market cap food chain, successful stocks don't graduate from the index – they make up more and more of the index as their relative values grow. Hence, large-cap index funds have some of the greatest potential for high levels of holdings concentration.

S&P 500 Index
Above Historical Average Concentration

Given that an S&P 500 index fund is often one of the two most significant core fund allocations in an average DC retirement plan (with the other being stable value), concentration in the S&P 500 Index should be of particular interest to plan sponsors.
From January 1990 through June 2023, the average allocation to the top ten holdings of the S&P 500 was 20.9%. In August 2015, just eight years ago, the top ten holdings stood at 17% of the index's total value – the lowest point since 1989. At the end of June 2020, the top ten holdings made up 27% of the index's value. That had been the highest concentration in the top names in 30 years, rivaled only by the Dot Com Bubble period of 1999-2000. Since then, however, the index's value has grown even more concentrated in its top constituents. At the end of June 2023, 30.5% of the S&P 500's market value resided in its top ten names.
In 2020, the top ten concentration was driven by the momentum of a select number of technology, consumer discretionary, and communication services stocks: Facebook, Apple, Netflix, Microsoft, Amazon, and Alphabet (Google). The three biggest names - Microsoft, Apple, and Amazon - comprised over 16% of the index. Three years later, those same three stocks continued to dominate the index and represented over 17% of the S&P 500's value.
Russell 1000 Growth
Above Historical Average Concentration

As in 2020, the same stocks driving concentration in the S&P 500 have had a similar impact on the Russell 1000 Growth Index. In June 2020, concentration in the index's top ten holdings stood at a then-high of 44%. Since then, that record has been dramatically eclipsed: at the end of the second quarter of this year, the index's top ten constituents represented 51.2% of its value. That compares to a historical average of 29.9% from December 1978 through June 2023 and is triple its 2007 low point of 17%.
To amplify that point, from January 1990 through June 2023, the top ten concentration of the Russell 1000 Growth averaged 29.9%. At the end of the second quarter of this year, roughly the same portion was allocated to just the three biggest names: Microsoft, Apple, and Amazon.
Russell 1000 Value Indices
Below Historical Average Concentration

In contrast to the 1000 Growth, the Russell 1000 Value's top ten concentration has changed little over the last three years. The allocation to the top ten stocks on the value side stood at 17.3% at the end of June 2023, roughly equal to June 2020. That compares to an all-time high of 34.5% in November 2008 during the Global Financial Crisis. The 1000 Value's top ten share hasn't been so low since the early 1990s, when it bottomed at 14.8% at the end of 1992.
From January 1990 through June 2023, concentration in the 1000 Value's top ten has averaged 23.1%, significantly higher than the June endpoint.
US SMALL CAP INDICES
US small-cap equity indices are unlikely to rival the potential top-name concentration of their large-cap counterparts. This is primarily due to a relative ceiling on market cap created by the graduation of growing companies from small- to mid-cap indices (the same goes for the relationship of mid- and large-cap indices). Following each annual June reconstitution of the Russell market cap-weighted small-cap indices, you can see a regular, jagged pattern of decreasing concentration. Because of the pattern of reconstitution, the concentration of each Russell small-cap index in June 2023 looked very similar to that in June 2020. Though the S&P SmallCap 600 Index follows a less mechanical methodology than the Russell benchmarks, the promotion of growing stocks into the S&P MidCap 400 Index has similarly governed the 600's holdings concentration.
S&P SmallCap 600 Index
Near Historical Average Concentration

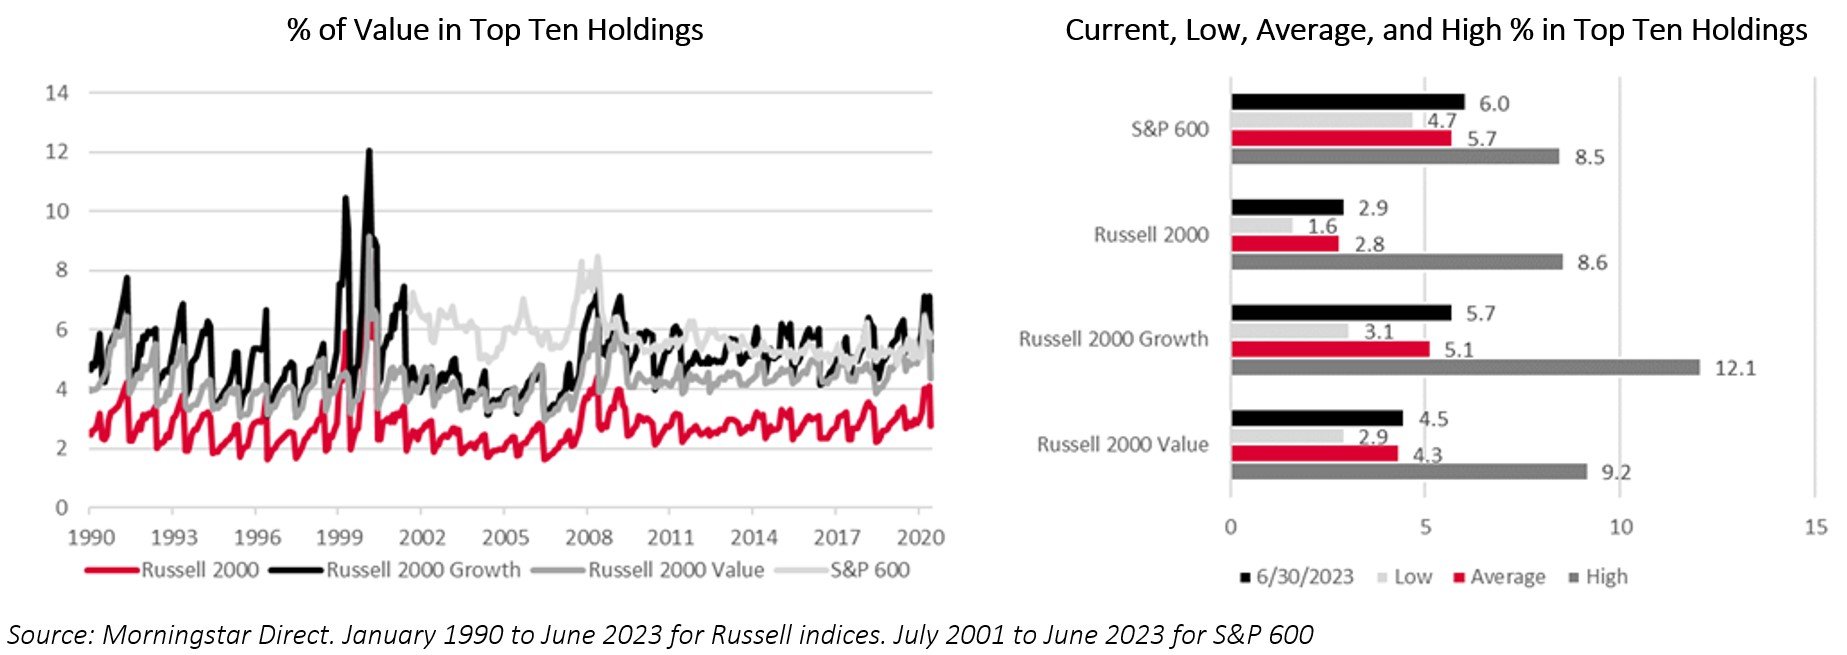
At the end of June, the top ten S&P SmallCap 600 Index stocks made up 6% of its total allocation. That compares closely to its average of 5.7% since June 2003. The index's long-run average is notably higher than that of the Russell 2000, owing to its more compact list of constituents. Since the index doesn't follow a scheduled reconstitution process (as do the Russell benchmarks), its pattern of concentration is much less regular than the Russell indices.
Russell 2000 Index
Near Historical Average Concentration

For most of the time since 1993, the top ten concentration of the Russell 2000 has hovered between 2 and 4% of the index's value. True to that form, it ended the second quarter at 2.9%. The primary escape from this range occurred during the Dot Com Bubble years of 1999 and 2000 (though the effect of the reconstitution reset is still evident in each of those years). Top name concentration topped at 8.6% in February 2000 but hasn't come close to that mark since
Russell 2000 Growth Index
Near Historical Average Concentration

The Growth and Value flavors of the Russell 2000 generally sustain a higher level of top-ten concentration than the parent index, given that they are smaller portfolios composed of subsets of the Russell 2000's constituents. The Russell 2000 Growth ended June with 5.7% of its value in the top ten names, just over its long-run average of 5.1% and a far cry from the all-time high of 12.1% hit during the Dot Com Bubble. The three months when the top ten exceeded 10% of value all occurred during the Dot Com years.
Russell 2000 Value Index
Near Historical Average Concentration

The top ten concentration in the Russell 2000 Value has historically run at a lower level than the Growth Index. The top ten index holdings have rarely exceeded 5% of total value since 1978 and, in only one month, exceeded 7%. At the end of the second quarter of this year, the top ten made up 4.5% of the index. The high point of concentration occurred in February of 2000 (the same month as the 2000 Growth), with a low of 2.9% in June of 2006.
EX-US EQUITY INDICES
As with US equity indices, concentration in ex-US indices is ordained by market cap segment (i.e., large-cap indices have more significant potential for holdings concentration risk than small-cap indices). However, multinational indices introduce an additional concentration factor for consideration: evolution in country-specific allocation.

MSCI ACWI ex USA
Near Historical Average Concentration

As a hugely diverse and "ceiling-less" index, the MSCI ACWI ex USA has characteristics that both hinder and contribute to concentration. Over the index's first decade, focus in the top ten grew from roughly 10% in 1995-96 to around 15% in 2000-2003. Top ten concentration fell back to about 10% in 2007 and has ranged between 8% and 13% since. In June 2023, it stood at 11.2%, compared to 12.1% three years before.
In 2020, we also discussed how the staggered inclusion of China A-shares and the strong performance of Chinese equities boosted the concentration in Chinese stocks in the Index from 7.7% in August 2018 to 11.7% in June 2020.
Things have turned a bit since then. The poor relative performance of Chinese stocks over the last three years served to shrink the MSCI ACWI ex USA's exposure to China over that period (the MSCI China had an annualized return of -10.26% from 7/1/2020 through 6/30/2023, compared to 7.22% for the overall MSCI ACWI ex USA and 2.32% for the MSCI Emerging Markets index). The index ended June 2023 with an 8.2% allocation to Chinese equities.

MSCI Emerging Markets
Above-average concentration

In contrast with other indices we've discussed, the holdings concentration of the MSCI Emerging Markets Index has dropped meaningfully since June 2020. The MSCI Emerging Markets Index held 28.6% of total value in its top ten names in June 2020 – an all-time high. That level of concentration was well above its January 1996 to June 2023 average of 20.2% and double its 1997 low of 14.1%. Over the following three years, holdings concentration moderated. The index ended June 2023 with 23.3% in the top ten names, a level much closer to historical norms.
Part of the cause for that moderation, the poor relative performance of certain Chinese stocks (and Chinese stocks in general), can also be seen in the decrease in the Index's allocation to China. In 2020, the index's exposure to China had been rising quickly, with China's share rising from 32.2% in June 2018 to 40.4% at the end of June 2020.
In a dramatic turn, the China share of the MSCI Emerging Markets had fallen to 29.1% at the end of the second quarter of 2023.

ACTIVELY MANAGED Funds
Most actively managed strategies used in retirement plans are, in some way, constrained by policy to their benchmark's holdings. For example, a strategy's managers may enforce a relative limit on the allocation to a security or sector compared to the weight of the security or industry in their benchmark index (i.e., the fund's allocation to X security or industry must be within +/- X% of the index's weight). The general intentions are limiting the potential for dramatic relative underperformance vs. the benchmark and maintaining style purity.
Strategies may place absolute limits on their allocation to a single holding or industry (e.g., the fund's allocation to a single security or an industry can't exceed X% regardless of the benchmark allocation). Here, the intent is to limit the potential for excessive concentration.
When holdings concentration increases in an index, the impact extends to active funds that are benchmarked to that index and have relative or absolute constraints. A relative constraint may force a fund to increase its allocation to a holding as its prominence in the benchmark increases. For example, if a fund must maintain the weight of a single security within +/- 3% of its benchmark weight and Apple makes up 12% of that benchmark, the fund will hold at least 9% of its assets in Apple. On the other hand, an absolute constraint may increase the differential between a fund and index allocation as the benchmark's allocation exceeds the fund's limit. For example, if a strategy is limited to a maximum allocation of 10% to a single security and Apple makes up 12% of its benchmark, the fund would effectively be forced to hold a 2% active bet against Apple.
You can read a more comprehensive look at how index composition affects active strategies here.
OUR PERSPECTIVE
As in 2020, we aren't suggesting that index funds that follow any specific benchmark are imprudent investments or that capitalization-weighting is an unreasonable indexing strategy. We aren't advocating against holdings constraints, relative or absolute, in actively managed funds. A fund that increases or decreases concentration or deviates significantly from a benchmark may still constitute a prudent investment option and still fulfill its intended role in a retirement plan.
We do have a few words of advice for plan fiduciaries:
Apply the same rigor to each investment in the plan, active or passive, and recognize that passive management doesn't suggest innate prudence.
Pay careful attention to how index options are communicated to participants (in writing, on the internet, or over the phone). There should be no implication that indexing offers any additional measure of safety or certainty. Whether investing in index or active funds, participants face the promise of gain and the threat of loss.
Ensure that plan fiduciaries are familiar with the investment policies of the plan's actively managed strategies and understand how changes in the composition of benchmarks can impart changes, absolute or benchmark-relative, to the portfolios of the plan's active funds.
Recognize that superficial familiarity with the plan's investments isn't enough. The law expects Fiduciaries to act as prudent experts; that's hard to do without sufficient information.
Contact Jay Young (jay.young@vergencepartners.com) or me (tom.douglas@vergencepartners.com) with any comments or questions about concentration in a specific index.
FOR INSTITUTIONAL USE ONLY
All data sourced from Morningstar. ©Morningstar 2023. All rights reserved. Use of this content requires expert knowledge. It is to be used by specialist institutions only. The information contained herein: (1) is proprietary to Morningstar and/or its content providers; (2) may not be copied, adapted, or distributed; and (3) is not warranted to be accurate, complete, or timely. Neither Morningstar nor its content providers are responsible for any damages or losses arising from any use of this information, except where such damages or losses cannot be limited or excluded by law in your jurisdiction. Past financial performance is no guarantee of future results.
Vergence Institutional Partners LLC is registered as an investment adviser with MA, MI, RI, and TN. Vergence Institutional Partners LLC only transacts business in states where it is properly registered or is excluded or exempted from registration requirements.
This report is a publication of Vergence Institutional Partners LLC. It is intended only for use by plan sponsors and fiduciaries. Information presented is believed to be factual and up to date, but we do not guarantee its accuracy, and it should not be regarded as a complete analysis of the subjects discussed. All expressions of opinion reflect the judgment of the author as of the date of publication and are subject to change.
Information contained herein does not involve the rendering of personalized investment advice but is limited to the dissemination of general information. A professional adviser should be consulted before implementing any of the strategies or options presented.
Information is not an offer to buy or sell, or a solicitation of any offer to buy or sell the securities mentioned herein.
Past performance may not be indicative of future results. Therefore, no current or prospective client should assume that the future performance of any specific investment, investment strategy (including the investments or investment strategies recommended by the adviser), or product made reference to directly or indirectly, will be profitable or equal to past performance levels.
All investment strategies have the potential for profit or loss. Different types of investments involve varying degrees of risk, and there can be no assurance that any specific investment will either be suitable or profitable for a client's investment portfolio.
Historical performance results for investment indexes or categories generally do not reflect the deduction of transaction and custodial charges or the deduction of an investment-management fee, the incurrence of which would have the effect of decreasing historical performance results. You cannot invest directly in an index.
Economic factors, market conditions, and investment strategies will affect the performance of any portfolio, and there are no assurances that it will match or outperform any particular benchmark.
20230823TLDTLD0051
© 2023 Vergence Institutional Partners LLC